Sleeping Around 2019-2020
 I've always viewed the data collection project I call Sleeping Around as being a great way to quantitatively encapsulate my life. Where I spend my nights seems to summarize my life for any given period pretty well. And with 12 years of data, I can make comparisons and see trends that I might not otherwise be able to do. And, in 20 years from now, I can look back and see what my 2019-2020 Sleeping Around analysis said—in short, what a strange year. I've always viewed the data collection project I call Sleeping Around as being a great way to quantitatively encapsulate my life. Where I spend my nights seems to summarize my life for any given period pretty well. And with 12 years of data, I can make comparisons and see trends that I might not otherwise be able to do. And, in 20 years from now, I can look back and see what my 2019-2020 Sleeping Around analysis said—in short, what a strange year.
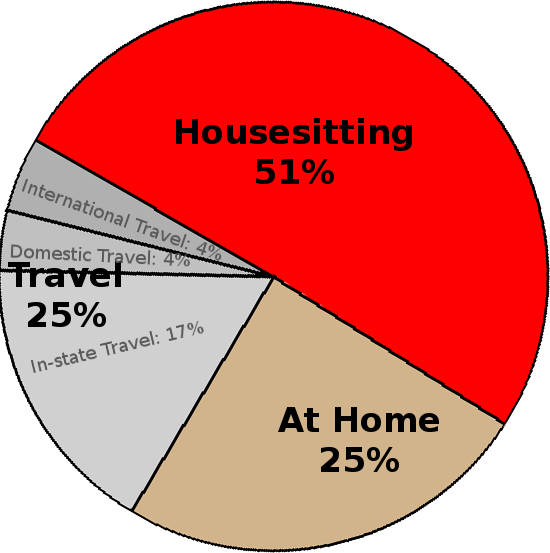
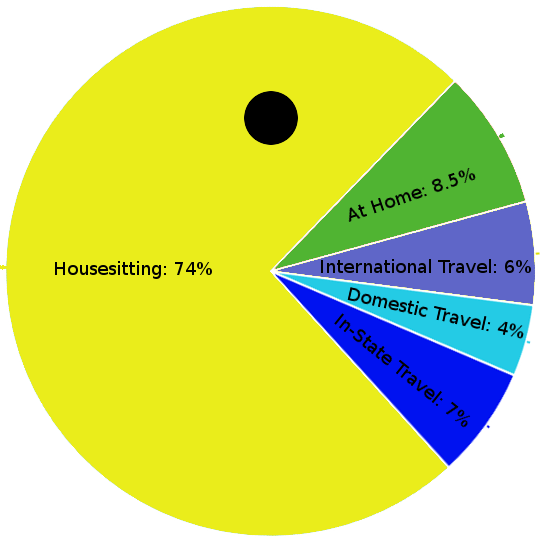
Needless to say, COVID-19 and its accompanying quarantine is the reason this year's data is so different. Cancelled housesitting, cancelled travel, and cancelled gigs all make for a pretty bland data set. In the 12 years I've been keeping data, I've never spent more than twenty-odd nights in a row at home, with anything over a week being a rarity. This year, I've only slept away from the Outback three nights in 5 months, with a solid 3-month uninterrupted at home chunk in middle of all that.  Nights at home vs. housesitting And while I know comparisons are basically moot, I'm a creature of habit, so here's a table of data:
Other observations and thoughts:
This yearly recap always makes me nostalgic, contemplative, and excited for the future, this year maybe more than ever. And with so much around me different and upside down, it is nice to have the warm consoling arms of data to make things feel just a little bit normal. |
| Sunday August 2 2020 | File under: stats |
| comment? |
Sleeping Around 2018-2019
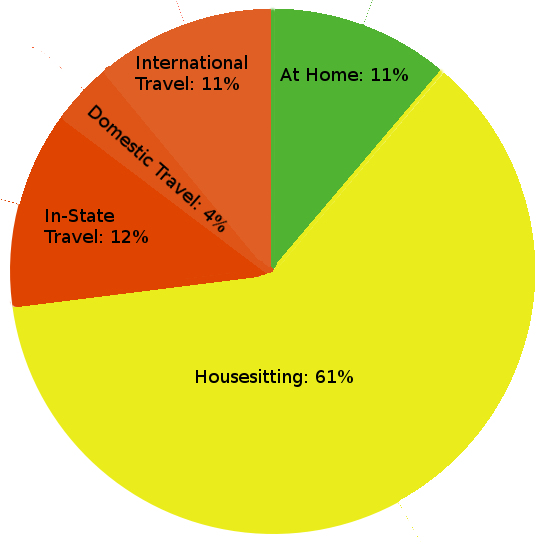
 The best way to sum up this year's Sleeping Around data, my annual dive into an attempt at comprehending my life through looking at where I lay my head, might be "as much as things change, they stay the same." Besides a few percentage points here and there, this year and last year look almost the same. But just because things look almost the same doesn't mean they don't warrant a closer look. The best way to sum up this year's Sleeping Around data, my annual dive into an attempt at comprehending my life through looking at where I lay my head, might be "as much as things change, they stay the same." Besides a few percentage points here and there, this year and last year look almost the same. But just because things look almost the same doesn't mean they don't warrant a closer look.
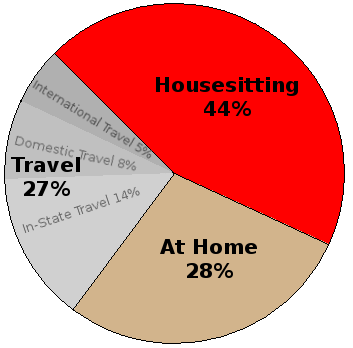
Housesitting is up; that's good. As our circus business grows, housesitting represents a less critical financial piece, but it is still a prominent part of our life that I would not like to see fade away. Travel is down; that's bad. Both overall and the two most interesting types of travel, international and domestic, are not nearly as high as I would like. After two years with no nights in a tent, we got 2, internationally no less. At Home percentage is spot on to the 10-year average, which I find oddly amusing. Other interesting stats from the year:
As always, I'm excited to see what the next year will hold. We've got a big international trip planned, some changes in the housesitting landscape, and as always, the possibility for the unseen. Life is fun. Looking at it through the lens of data is fun too! |
| Friday August 2 2019 | File under: stats |
| comment? |
Sleeping Around 2017-18
 It's that time of year again, time for me to take stock of my life through numbers: it's Sleeping Around Round-Up time!! As I'm sure you all know, I track where I sleep every night and post it for the world to see. Then, every year, I dive into the number to see what it can tell me. Being that this year's data is year 10, perhaps a little extra analysis is warranted. It's that time of year again, time for me to take stock of my life through numbers: it's Sleeping Around Round-Up time!! As I'm sure you all know, I track where I sleep every night and post it for the world to see. Then, every year, I dive into the number to see what it can tell me. Being that this year's data is year 10, perhaps a little extra analysis is warranted.
Firstly, as compared to last year and much of the year before, things are a bit skewed. Comparatively, housesitting is way down. But this due to the "Mansion effect", i.e. no longer having the longtime Bellingham stint (posted about here). Looking back to pre-Mansion time, housesitting is up and travel is a bit down, but not too far from normal all around. Other observations:
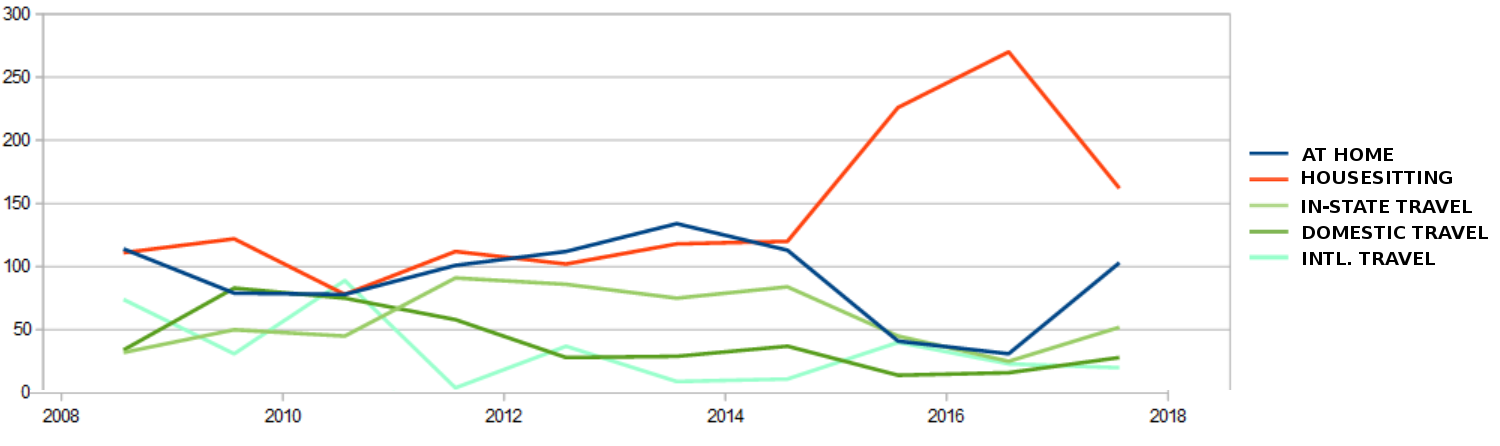
As always, I encourage you to examine the data yourself and to look back at previous years' posts (which can easily be found from the archive page.) TEN YEARS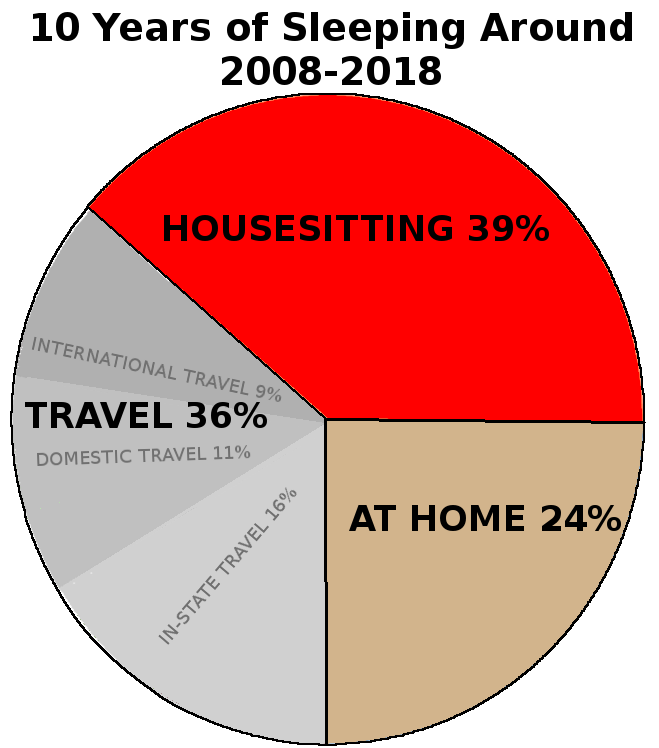 Just for funsies, I did a bit of a 10 year analysis as well. The numbers are remarkably...well, predictable. I guess it turns out that I lead a pretty regular life in some senses. Sure there are spikes in travel or housesitting various years, but afterward, it seems to return to a steady average. Just for funsies, I did a bit of a 10 year analysis as well. The numbers are remarkably...well, predictable. I guess it turns out that I lead a pretty regular life in some senses. Sure there are spikes in travel or housesitting various years, but afterward, it seems to return to a steady average.
A few interesting facts pop out at me, like I've spent 261 nights in a car in the past 10 years and almost a year outside of the country. And some trend emerge, like downward slide in travel and the aforementioned lack of nights in tent. But overall, this data is becoming what data sometimes has a tendency to do: boring. But even thought it may be predictable and/or boring, I still find it incredibly informative. And I hope to have a second 10 years' worth of data to compare to this first decade down the road. 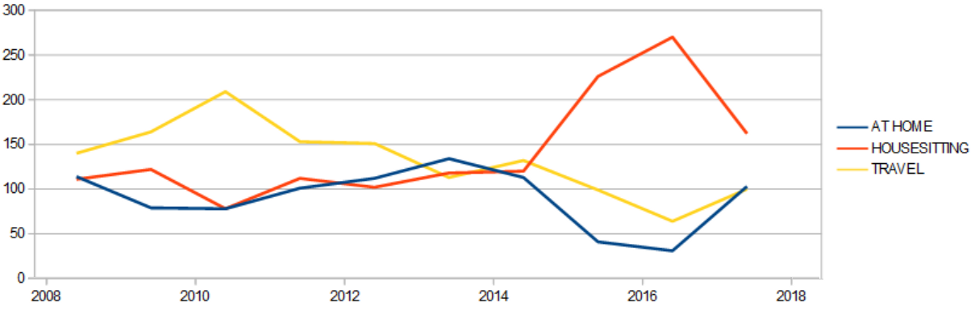
(I originally did this graphic with in-state, domestic, and international travel all separate, but the graph was a bit unwieldy (though still informative)) | ||||||||||||||||||||||||
| Monday August 20 2018 | File under: stats |
| comment? |
Breakdown of Earnings 2017
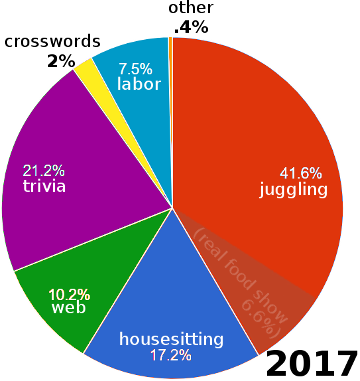 Last year, I made a post that summarized my earnings for the year. It started with all sorts of caveats regarding the taboo of talking about money, etc. etc. All the same caveats apply for this year, so feel free to go back and review them. But basically, I'm posting a summary of my yearly earnings for the same reason I post about my sleeping around data—because I think it is neat and an incredible tool for self-analysis. Last year, I made a post that summarized my earnings for the year. It started with all sorts of caveats regarding the taboo of talking about money, etc. etc. All the same caveats apply for this year, so feel free to go back and review them. But basically, I'm posting a summary of my yearly earnings for the same reason I post about my sleeping around data—because I think it is neat and an incredible tool for self-analysis.
In last year's post, I talked about achieving a life goal (of sorts) of having no more than one quarter of my income come from a particular source. This year, I guess I juggled my way out of that one. But I think it's good. With this data, I can see that I'm succeeding as a juggler and I have no small amount of pride in that. Other numbers–housesitting, trivia, labor, crosswords–aren't changed too much. It's neat to see that those elements aren't necessarily suffering from juggling's big takeover. I look forward to continuing tracking, analyzing (,and probably blogging about) this data in the upcoming years. It is truly mind-boggling how much interest I find in these simple numbers. But for now, it is just nice to have an answer to the question "What do you do for a living?". |
| Thursday February 22 2018 | File under: stats |
| comment? |
Sleeping Around 2016-207
 I shall start this year's sleeping around post as I do almost every year's, with an explanation. My Sleeping Around project (now entering it's 10th year!) is my attempt at capturing and quantifying my life through where I rest my head. I attempt to summarize the year's data around this time every year and tease out the secrets that it holds. Let us begin. I shall start this year's sleeping around post as I do almost every year's, with an explanation. My Sleeping Around project (now entering it's 10th year!) is my attempt at capturing and quantifying my life through where I rest my head. I attempt to summarize the year's data around this time every year and tease out the secrets that it holds. Let us begin.
This year's Sleeping Around data is the least diverse to date, by far. In fact, it is so boring that I had to make the pie chart into a pac-man in hopes of even getting myself to care. But even in the most boring data lies interesting tidbits. Interesting Tidbits:
Years from now, when I look back on all my Sleeping Around data, will I see the 2016-2017 year as an anomaly like it feels now or will it be the beginning of a trend? The only way to find out is to keep collecting data. And that's exactly what I plan to do! (Previous year's analyses: '08-'09, '09-'10, '10-'11, '11-'12, '12-'13, '13-'14, '14-'15, '15-'16. And this year's data) | ||||||||||||||||||
| Wednesday August 9 2017 | File under: stats |
| comment? |
A Breakdown of Earnings
 They say money is a taboo subject. And while I see that, I'm somewhat inclined to disagree. I love talking about money and actually find exchanging ideas on the subject to be insightful. So it is with that spirit that I present my latest data collecting project. They say money is a taboo subject. And while I see that, I'm somewhat inclined to disagree. I love talking about money and actually find exchanging ideas on the subject to be insightful. So it is with that spirit that I present my latest data collecting project.
For the past 3 or so years, I've been taking data on my various jobs the same way I take data on my sleeping around, which is to say meticulously. I've recently taken all the data and categorized it and entered it into a database for easy analysis. The result? Well, for one, I got this fancy pie chart representing my income streams for 2016. I've left off amounts because 1) that starts to creep over that taboo line and 2) you never know where lurks the tax man. (Note for the tax man: you're wasting your time. Small potatoes doesn't even begin to describe it.) Similarly to the Sleeping Around Data Project, this bean counting has led to some great analysis. Some obvious noteable trends over the past 3 years of data: web and labor income are down while juggling and trivia income are up. Also, I can see the breakdown of housesitting by client which can cross reference with the Sleeping Around data nicely. Basically, there are a bunch of numbers that I really like looking at.   Many years ago, a friend asked me what I wanted to do when I grew up. I responded that I didn't want any job that accounted for more than a quarter of my total earnings, so as to avoid burnout and maintain variety in my life. Now, some 16 years later, it seems that that's pretty much where I am. Pretty dang neat! |
| Friday January 20 2017 | File under: stats |
| Toggle Comments (2) | comment? |
Sleeping Around 2015-2016
 Another year, another year's worth of sleeping around data. This brings me to 8 years worth of data on where I slept every night. That's 2922 nights. It's kind of crazy having a log of something so simple for so long, but I love it. And I love analyzing it. So, without further ado... Another year, another year's worth of sleeping around data. This brings me to 8 years worth of data on where I slept every night. That's 2922 nights. It's kind of crazy having a log of something so simple for so long, but I love it. And I love analyzing it. So, without further ado...
Observations:
If you care to have a look at the data yourself, do so here*. And if you really want to get into the weeds of data, you can look over my last 7 Sleeping Around posts: '08-'09, '09-'10, '10-'11, '11-'12, '12-'13, '13-'14, '14-'15. Otherwise, I hope you enjoyed my analysis even a tenth as much as I enjoyed making it. Really, nothing better than this data set helps me encapsulate my life in numbers. | |||||||||||||||
| Wednesday August 3 2016 | File under: stats |
| Toggle Comments (2) | comment? |
Sleeping Around 2014-2015
 If ever there was a case of data being both boring and exciting at the same time, this is it. Data from my Sleeping Around calendar from the last year both captures my imagination with its simple encapsulation of a life and almost puts me to sleep with its predictability. If ever there was a case of data being both boring and exciting at the same time, this is it. Data from my Sleeping Around calendar from the last year both captures my imagination with its simple encapsulation of a life and almost puts me to sleep with its predictability.
First, the predictable stuff: as has been the case for the last 3 or so years, my time comes out almost evenly split between the 3 major categories. Nights spent housesitting changed by less than 2%. The division of travel between its 3 sub categories stayed more or less similar, thought a 9 day trip to Dominican Republic boosted the international numbers. All in all, this year was a lot like last year. As for the exciting stuff, just analyizing and presenting the data makes me smile. Little differences like a drop in nights in a car or a jump in nights in a hotel reflect little excitements that make this year different than last year.
As my database* grows with more years of data, the more I like looking at the trends slowly emerging. Here's what 7 years looks likes. 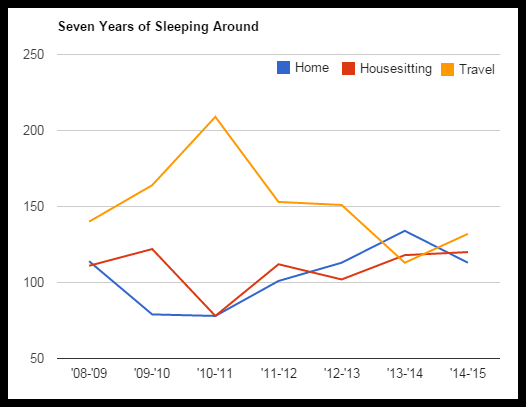 And, with past years to compare this year to, setting goals for next year is easier. Resolved: I will spend more than 1 night in a tent, and my international travel numbers will go up*. But most of all, I resolve to keep logging the data! (For recaps on previous years sleeping around, check out these posts: '08-'09, '09-'10, '10-'11, '11-'12, '12-'13, and '13-'14.) | |||||||||||||||||||||
| Wednesday August 5 2015 | File under: stats |
| comment? |
Sleeping Around 2013-2014
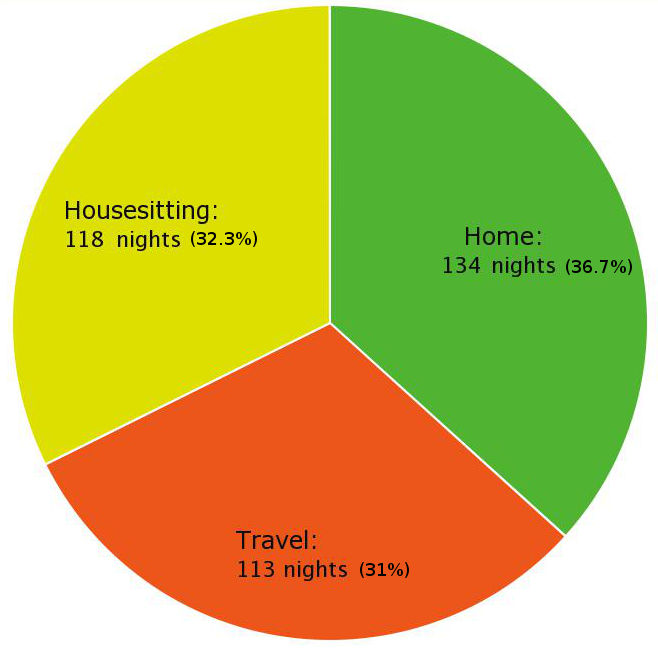 Who's ready to nerd out on the most insignificant details and break them down statistically!?! Everyone? Good, that's what I thought. So without further ado, here's the breakdown of my year of Sleeping Around™, the industry standard for tracking one's itinerant life. Who's ready to nerd out on the most insignificant details and break them down statistically!?! Everyone? Good, that's what I thought. So without further ado, here's the breakdown of my year of Sleeping Around™, the industry standard for tracking one's itinerant life.
Some interesting observations: this year takes the cake for most nights spent at home, up 20 nights from the previous high mark (and up 37(!) over the 5-year average). I attribute this to the settling that Della and I have been doing in the Outback (covered here). Also notable is the record low number of travel, down almost a full month from the previous low mark (down 50(!) nights from the 5-year average). While there's a twinge of regret in seeing that number, I also know that it's low because I've got a pretty dang good life for myself here on the home front so there's less fun to be had in leaving. But still, I hope to see this number rise for the '14-'15 year (esp. that peskily low international travel number). Other fun data:
Since this is year number 6* of data collection, I thought I'd throw a fun little Over the Years graph, a fun way to compare year to year. 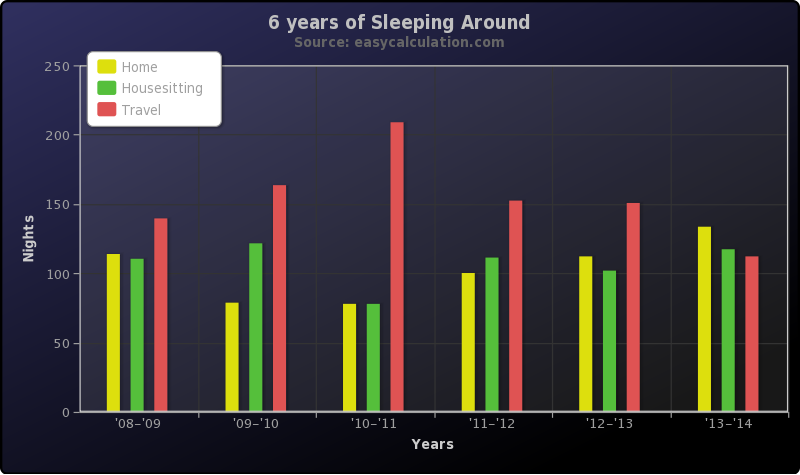 To have a further look at this year's data so you can run your own graphs and charts, go here. Posts on previous years sleeping around can be found here: '08-'09, '09-'10, '10-'11, '11-'12, and '12-'13 | ||||||||||||||||||||||||||
| Monday August 4 2014 | File under: stats |
| Toggle Comments (1) | comment? |
Sleeping Around 2012-2013
 Anyone familiar with this blog probably knows about my favorite pet project, my sleeping around page, so I'll save you the ramblings about how I feel it encapsulates my life, how much fun I have making it, and how I hope to keep on collecting data for a long time to come* Well, my ubicational year has recently come to end and it serves as a great time to sum up the data. Anyone familiar with this blog probably knows about my favorite pet project, my sleeping around page, so I'll save you the ramblings about how I feel it encapsulates my life, how much fun I have making it, and how I hope to keep on collecting data for a long time to come* Well, my ubicational year has recently come to end and it serves as a great time to sum up the data.
From a general categories standpoint, things look pretty average*, either a testament to how predictable my life has become or evidence that over the span of a year, even erraticness can average itself out.. On the subcategory level, however, we see a dramatic increase in international travel over last year which brings it up to about the 5-year average. An interesting, yet unsurprising, rising trend is the number of nights spent at the quarry (47). I can only imagine that with the impending completion of my cabin, that number will continue to rise.
While I could probably go on about the ins and outs of this data for hours, I'll spare you the pain. If you're really that interested, play with the full data yourself. Previous years' posts can be found here: 2008-2009, 2009-2010, 2010-2011, and 2011-2012. | ||||||||||||||||||||||||||
| Thursday August 22 2013 | File under: stats, travel |
| Toggle Comments (1) | comment? |
| < Previous Page Next Page > |
| 1 2 |
Recent Comments:
*Horge on Mother Wrenger in the Nutcracker
*Horge on A Whirlwind Eclipse Adventure
*Andrew on A Whirlwind Eclipse Adventure
*Mom on A Whirlwind Eclipse Adventure
*Mom on Mother Wrenger in the Nutcracker
Recent Content:
*A Whirlwind Eclipse Adventure
*Mother Wrenger in the Nutcracker
*Malta Bene!
*2023 Performance Review
*Twas the Night 2023
*Recycled Plastic Christmas Ornaments
*Halloween Act 2023 - Dueling Banjos
*Walk Like MADD 2023
*New Stilting Costume
*Sleeping Around 2022-2023
*Project Hotdog Halfway Complete
*Giant Juggling Club
Websites du Friends:
* Wren the Juggler
My I-guess-I'm-a-Professional-Juggler juggling website
* Wren and Della
Della and my juggling website
* The Real Food Show
A circus-inspired elementary assembly show to teach kids about healthy eating
* Della Moustachella
Della's performance website
* The Fun Bags
Della and Sadye's Performance Troupe
Tags
Anacortes (39)
Cambodia (5)
China (14)
Korea (1)
Macau (1)
Mexico (13)
New Zealand (1)
Seattle (2)
Thailand (18)
USA (11)
Vietnam (5)
beard (5)
blog (8)
books (1)
coding (15)
comic (45)
contest (4)
environment (9)
events (12)
food (22)
games (15)
geocaching (4)
holidays (13)
juggling (8)
links (9)
meet-ups (1)
mexico (1)
misc (54)
movies (5)
open letter (2)
participation (1)
pics (39)
poetry (6)
poll (1)
quote (6)
road trip (25)
stats (1)
transportation (14)
travel (136)
video (6)
work (8)